Default Port-
9704 for Analytics and 7001 for both em and
console.
OBIEE Architecture
OBIEE (Oracle Business
Intelligence Enterprise Edition) latest version is 11.1.1.5 or 6.It is a
reporting tool for generate the reports to analyses the data. OBIEE has 2 default servers BI server and Presentation server.
It has 6 components in the architecture
1. Presentation services (Answers or Analysis)
2. Presentation server
3. Repository
4. BI server
5. Database connection
(ODBC (Open database connectivity) or OCI (Oracle
call Interface))
6. Enterprise Data ware House
Presentation Services: This is a front-end page for users
or clients. User can see the reports from the Answers or Analysis page. It contains answers, dashboards, and account details privileges of
the specific users. We can the reports and dashboards
based on the client requirement. By starting the presentation
server, we can operate the presentation services.
Repository: It is also called as RPD or RCU. Metadata settings are
configured in the rpd level. It has 3 layers
Physical layer: It has the direct connection
with the database.
We can apply the joins between fact tables and dimension tables based
on the data-modeling.
Business model and mapping layer: The logical changes will be
done here like creating logical joins(complex joins),new columns or tables, hierarchies
etc.
Presentation layer: The objects will be visible to
the users what placed in the presentation layer. We can apply the security
setting in the presentation layer.
We can operate the Repository settings by
starting the BI server.
we can open the RPD in either online or offline mode
Database connection: This is the database connection
between database and OBIEE.
The database connection is either ODBC or OCI.
Data-ware House: Data-ware House is a huge data storage space for retrieving data.
OBIEE, is really every table is set to cacheable by default?
No, by default some of the physical tables are not set cacheable
because those tables are maintained with large volume of data, so it may lead
to performance issues.
We can Observe the cacheable option : table->properties
I have a report, built with columns like order_no, order_date,
order_locetc..In the report i can able to see the data perfectly but when i
download the report to excel the data column is showing the unexpected result.
Is it a expected scenario? If yes, how can i resolve this?
Yes, this is an expected behavior,
so we have to externally tell the BI serer to follow a specific format when
download the report.
Steps:
Analysis->column
properties-> Custom CSS style
format->specify the date format ->mso-number-format:”\@”
I have a dashboard prompt, which is a edit
box. I want to use the edit box as case in-sensitive filter in my
dashboard page. Is it possible?
Yes, It is possible you can achieve this required my changing the
configuration setting in theNQSconfig.INI file.
CASE_SENSITIVE_CHARACTER_COMPARISON = OFF;//by default ‘ON’
enabled
Restart the services and observe the behavior of the Edit box.
Business Intelligence:
Business Intelligence is a methodology to represent the raw data into a
meaningful format for the business purpose.It always deals with the data warehouse to handle or process the
large volume of data.Meaning,the data analysis will make users to understand
the business and able the take the decisions.
How does it helps in the real world scenarios?
Generally BI show the data in a tabular/pictorial format that will support the
business users to analyse the data w.r.t trending and making the business
decisions.
How can we master on Business Intelligence?
The only source to become a master in BI is Explore Business Domain Knowledge.Ingeneral, only
the domain Experts can build the best solution for business because they have
an awareness of the business functionality and KPIs.
Business Intelligence also deals with Data Integration,
Transformation, Management and Quality by using Different Tools like
MSBI(Microsoft Business Intelligence) , OBIEE(Oracle Business Intelligence
Enterprise Edition) etc.
Future of Business Intelligence:
Business Intelligence will exist in the world till the business exists because
the word itself is saying it is “BUSINESS INTELLIGENCE”.
What is the difference between Obiee 10g &
11g?
OBIEE - 11g
1. 64-Bit
2. Server
Name – Weblogic Server or you can call Oracle Enterprise Manager Fusion
Middleware
3. Repository
and Configuration in EM - Oracle Enterprise Manager Fusion Middleware
4. User,
Group Created in Fusion middleware console and Role Created in EM
5. You
can integrate with any application for example Salesforce, SAP or all CRM tool.
Because 11g have separate console where you can do deployment, Integration.
6. Time
series function - Ago, Today and period rolling. Added new TSF i.e.
PERIODROLLING
7. Dimension
Hierarchies - Level-Based Hierarchy and Parent-Child Hierarchy, introduces new DH i.e. Parent-Child Hierarchy
8. Repository
password protection. Need RPD password.
9. The
RPD now has a password. This security is partially to protect the RPD
access,
10. KPI
and Scorecard was introduces in OBIEE 11g
11. REQUESTS
have been renamed to ANALYSIS
12. IBOTS
have been renamed to AGENT
13. CHARTS
have been renamed to GRAPHS
14. Presentation
columns have been renamed to attribute columns
15. 11g
supports Ragged & Skip Level Hierarchy
16. Column
selector in 11g can be defined on multiple columns
17. The
ability to create custom print layouts for dashboard page
18. You
can now change the repository password from the command line using the
obieerpdpwdchg utility
19. Breadcrumbs
-It allows users to keep track of their locations within programs or documents
20. New
Graphs Waterfall graph, Stacked graph and 100% Stacked graph in n
11.1.1.7
21. Map
view is a new view type that presents data in spatial form
22. 11g
allows us to work with multiple subject areas in same report.
23. New
Menu Options for Exporting Views and Results I.E - Excel 2007+ and PowerPoint
2007+
24. SQL
Results prompt option -If you are working with double columns, you can now
write the SQL statement so that filtering is done on code values rather than
display values
25. New
View type i.e. - performance tile in 11.1.1.7
26. To
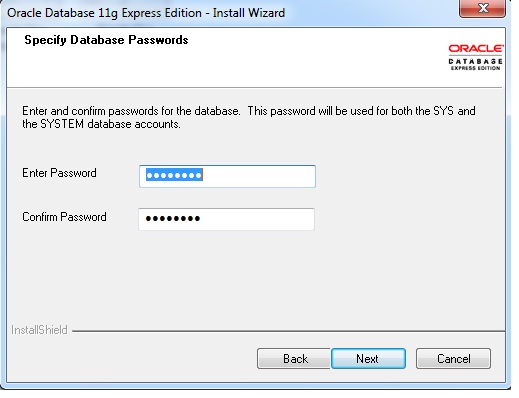
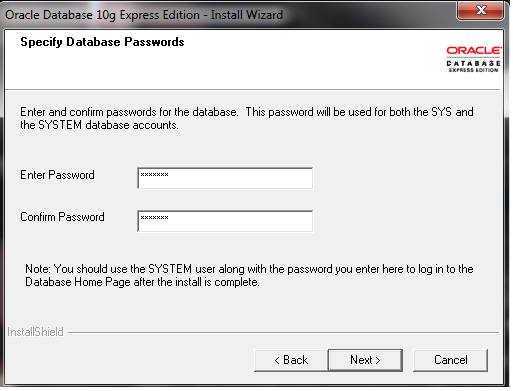
install OBIEE 11g, You Must have to install database and RCU.
27. Recommended
Visualizations Feature for Creating Views
OBIEE - 10g
1. 32
Bit
2. Server
Name - OC4J - Oracle Containers for J2EE
3. Repository
and configuration Upload is done in NQSConfig.ini
4. User,
Group and Application role are created in Repository
5. Integration
with other application like SAP or other CRM tool it was not easy. Easy
integration with only Siebel CRM
6. Two
Time Series function - Ago and Todate.
7. Dimension
Hierarchies - only you can do Level-Based Hierarchy
8. No
Repository password protection
9. RPD
has a no password. There was no protection for RPD
10. KPI
and Scorecard was not introduces in OBIEE 10
11. REQUESTS
have been renamed to ANALYSIS in 11g
12. IBOTS
have been renamed to AGENT in 11g
13. CHARTS
have been renamed to GRAPHS in 11g
14. Presentation
columns have been renamed to attribute columns in 11g
15. 10g
does not support Ragged & Skip Level Hierarchy
16. Column
selector in 10g can be defined just one column
17. No
Option to create custom print layout for dashboard page.
18. No
Breadcrumbs option
Can i use an OLTP backend database for
creating a dashboard?
Technically you can use OBIEE with OLTP as well. However real world
scenarios pertaining to OLTP makes it difficult for OBIEE to create Star schema
from OLTP. Also OBIEE is an engine to perform analytics queries, while in most
cases queries generated against OLTP schemas are operational in nature. Better
option is to use BI publisher and do away with OBIEE when querying against
OLTP.
OBIEE works with any database if you force to do. If you want to follow best
practices, its recommended to use with OLAP systems. After all OBIEE is
analytics reporting tool and OLAP databases were designed for reporting
requirements. So its always advised use the OLAP to get better performance and
better analytics from OBIEE.
Which version of OBIEE you are using?
Go to help in the repository of your project.
There we can get the exact version of OBIEE.
What is the difference between OCI and ODBC?
OCI will be specific to the oracle database
but the ODBC connection, we can use with any data source.
Have you ever worked on Joins? If yes how?
Yes, In physical layer i worked on joins based
on the data-modelling document.
Define
repository in terms of OBIEE?
Repository
stores the Meta data information. The extension of the repository file is
“.rpd”. With OBIEE Server, all the rules needed for security, data
modeling, aggregate navigation, caching, and connectivity is stored in metadata
repositories. Each metadata repository can store multiple business models.
OBIEE Server can access multiple
repositories
Repository is divided into three layers,
1.
Physical – Represents the data Sources
2. Business – models the Data sources into Facts and Dimension and
applies business logic.
(BMM Layer-
Business Model & Mapping Layer)
3. Presentation – Specifies the user’s view of the data rendered in OBIEE
answers client
What is the
end to end life cycle of OBIEE?
OBIEE life cycle:
1.
Gather Business Requirements
2. Identify source systems
3. Design ETL to load data to the Data Warehouse
4. Build a repository
5. Build dashboards and reports
6. Define security (LDAP or External table)
7. Based on performance, decide on aggregations and/or caching mechanism.
8. Testing and QA.
Active Directory is a database based system that provides authentication,
directory, policy, and other services in a Windows environment
LDAP (Lightweight Directory Access Protocol) is an application protocol
for querying and modifying items in directory service providers like Active
Directory, which supports a form of LDAP.
What is an Ad Hoc Query?
Ad hoc query means the query that we
normally write in query editor
For example in toad
if you write like...select count(*) from w_employee_d...it
means it's an ad hoc query.
Ad-hoc
means anything...it's not planned.
It's like a partition.
Let say we have fact or dimensional data in one or more different tables or
data is splited in different data sources. Then each logical table source
represents one data segment.
The term Fragmentation is more an
OBIEE term whereas the term partitioning refers more to the database
side of the same coin. Depending of a value of column, you can split the query
against a table or another. Very often, the tables are fragmented according to
the most important dimension in a star schema the time dimension.
This functionality is also available in the database and it’s a
better way to implement it in the database rather than in OBIEE. Why?
First,
because it’s really the job of a database to optimize the performance of
a SQL statement. If you go through the Oracle
Database Optimizer (the motor of the database), you will see
that it has more and more way to do it.
Second
because all data access tool will benefit of this functionality transparently.
The goal is simple, it’s :
·
to reduce the I/O (disk) effort
·
to increase the selectivity to
increase at the end the performance.
We use fragmentation when we have fact
or dimensional data in one or more different tables or data issplitted in
different data sources. Then each logical table source represents one data
segment.
For example, clients, in the first
table are clients from A to M, in the second from M to Z.
How do you create a business model when you
have only one source table in Physical layer?
This is very much possible and
feasible. It’s called as Single Table model. Good example is SA System Subject
Area where we just have a single physical source. No need to create Alias in
Physical. Simply use the same table twice in BMM with one Logical Table as
Dummy Fact. Like say Count of Users (aggregated). Then apply normal Complex
join in BMM and present in presentation layer.
Differences B/w
Chronological Key and Logical Key
Chronological key is the key which
uniquely identifies the data at particular level. Chronological key is mostly
used in time dimensions where time series functions are used.
Where as logical key is the key which is used to define the unique elements in
each logical level. A logical level may have more than one level key. When that
is the case, specify the key that is the primary key of that level. It is used
to specify the column which is used for drill down and which is used as primary
keys.
Components of
BIEE
Oracle BI (Business Intelligence)
consist of following components
i) BI Server- maintains logical data model in local proprietary file (.rpd).
ii) BI Presentation Service – provide framework and
interface for presentation of BI data to web clients.
iii) BI Publisher – generates enterprise reports
iv) BI Scheduler - scheduling reports to be delivered to user at specified
time
v) BI Java host- provide services to presentation services for
charts, PDFs and Gauges
vi) BI Presentation Service plug-in – entry point for web clients
to presentation service requests.
An event polling table (S_NQ_EPT) is a way to notify the Oracle
BI Server that one or more physical tables have been updated. Each row that is
added to an event table describes a single update event. The cache system reads
rows from, or polls, the event table, extracts the physical table information
from the rows, and purges cache entries that reference those physical tables.
Finally it
truncate the Event Table (S_NQ_EPT)
What is
connection pool and how many connection pools did you have in your last
project?
Connection pool is needed for every
physical database.
It contains information about the connection to the database, not the database
itself.
Can use either shared user accounts or can use pass-through accounts we can
have multiple connection pools for each group to avoid waiting
What is the
purpose of Alias Tables?
An Alias table is a physical table
with the type of Alias. It is a reference to a physical table, and inherits all
its column definitions and some properties from the physical table. A logical
table source shows how the logical objects are mapped to the physical layer and
can be mapped to physical tables, stored procedures and select statements. An
alias table can be a reference to any of these logical table source types.
Alias Tables can be an
important part of designing a physical layer. The following is a list of the
main reasons to create an alias table:
1. To reuse an existing table more than once in your physical layer (without
having to import it several times)
2. To set up multiple alias tables, each with different keys, names, or joins
3. To help you design sophisticated star or snowflake structures in the
business model layer. Alias tables are critical in the process of converting ER
Schemas to Dimensional Schemas.
How do you define
the relationship between facts and dimensions in BMM layer?
Using complex join we can define
relationship between facts and dimensions in BMM layer.
Did you create
any new logical column in BMM layer, how?
Yes. We can create new logical column
in BMM layer.
Example: Right click on fact table> select new logical column>give name
for new logical column like Total
cost.
Can you use
physical join in BMM layer?
Yes we can use physical join in BMM
layer.
Can you use outer
join in BMM layer?
Yes we can. When we are doing complex
join in BMM layer in the join properties we have an option to change the type
of join to left outer, right outer, full outer or inner.
What is level
based metrics?
Level based metrics means, having a
measure pinned at a certain level of the dimension.
A LBM is a metric that is defined for
a specific level or intersection of levels.
Monthly Total Sales or Quarterly Sales are the
examples.
Ex: if you have a measure called “Dollars”, you
can create a “Level Based Measure” called “Yearly Dollars” which is Dollars for
a Year. This measure will always return the value for the year even if you
drill down to a lower level like quarter, month, etc. To create a level based
measure, create a new logical column based on the original measure (like
Dollars in the example above). Drag and drop the new logical column to the
appropriate level in the Dimension hierarchy in the above example you will drag
and drop it to Year in Time Dim.
What is logging level? Where can you set logging levels?
You can enable logging level for individual users.
We can set the logging level based on the amount of logging you want to do. In
normal operations, logging is generally disabled (the logging level is set to
0). If you decide to enable logging, choose a logging level of 1 or 2. These
two levels are designed for use by Siebel Analytics Server administrators.
Set Logging Level:
1. In the Administration Tool, select Manage > Identity.
2. The Identity Manager dialog box appears.
3. Double-click the user’s user ID.
4. The User dialog box appears.
5. Set the logging level by clicking the up or down arrows next to the Logging
Level field
What are
different types of variables? Explain each.
There are two classes of variables:
1. Repository variables
2. Session variables
Repository
variables-
A repository variable persists from the time the repository is started.
Static: This value does not change
until a Siebel Analytics Server administrator decides to change it.
Dynamic: The values of these
variables change with the values returned by queries. These variables are
linked to an initialization block. An initialization block contains a SQL
query. When the repository is started the value returned by the query in the
initialization block will be assigned to the dynamic variable.
Session Variables-
Session variables are created and assigned a value when each user logs on (when
a new session is started).
There are two types of session
variables:
1. System: System variables have
reserved names, which cannot be used for other kinds of variables (such as
static or dynamic repository variables, or for non-system session
variables).
Ex: To filter a column on the value of the
variable LOGLEVEL set the filter to the Variable NQ_SESSION.LOGLEVEL.
2. Non-system: A common use of non-system variables is for
setting user filters.
Ex: you could define a non-system variable
called ‘SalesRegion’ that would be initialized to the name of the user’s sales
region. You could then set a security filter for all members of a group that
would allow them to see only data pertinent to their region. For example, to
filter a column on the value of the variable ‘SalesRegion’ set the filter to
the Variable NQ_SESSION.SalesRegion.
What is
Authentication? How many types of authentication do we have in OBIEE?
Authentication is the process by which
a system verifies a user with the help of a user ID and password. It checks if
user has the necessary permissions and authorizations to log in and access
data.
There are 4 main types of
Authentication in OBIEE:
Operating system authentication
External table authentication
Database authentication
LDAP authentication
What is object
level security?
There are two types of object level
security: Repository level and Web level
Repository level: In presentation
layer we can set Repository level security by giving permission or deny
permission to users/groups to see particular table or column.
Web level: this provides security
for objects stored in the OBIEE web catalog, such as dashboards, dashboards
pages, folder, and reports you can only view the objects for which you are
authorized.
For example,
a mid-level manager may not be granted access to a dashboard containing summary
information for an entire department.
What is data
level security?
This controls the type or amount of
data that you can see in a report. When multiple users run the same report the
results that are returned to each depend on their access rights and roles in
the organization. For example a
sales vice president sees results for all regions, while a sales representative
for a particular region sees data for that region.
What is the
difference between Data Level Security and Object Level Security?
Data level security controls the type
and amount of data that you can see in a report. Object level security provides
security for objects stored in the OBIEE web catalog like dashboards,
dashboards pages, folder and reports.
How do you
implement security using External Tables and LDAP?
Instead of storing user IDs and passwords in an OBIEE Server repository, you
can maintain lists of users and their passwords in an external database table
and use this table for authentication purposes. The external database table
contains user IDs and passwords, and could contain other information, including
group membership and display names used for Siebel Analytics Web users.
Instead of storing user
IDs and passwords in an OBIEE Server repository, you can have the OBIEE Server
pass the user ID and password entered by the user to an LDAP (Lightweight
Directory Access Protocol) server for authentication. The server uses clear
text passwords in LDAP authentication. Make sure your LDAP servers are set up
to allow this.
If you have 2
fact and you want to do report on one with quarter level and the other with
month level how do you do that with just one time dimension?
Using level base metrics.
If you want to
create new logical column where will you create (in repository or dashboard)
why?
It would be better if we create a new
logical column in repository because if it is in repository you can use it for
any report. If you create new logical column in dashboard then it is going to
affect only those reports which are on that dashboard. We cannot use that new
logical column for other dashboards.
What
is complex join, and where it is used?
To join a dimension table and fact table in
BMM layer we use a complex join.
If you want to
limit the users by the certain region to access only certain data, what would
you do?
Using data level security.
In the Admin tool: go to Manage -> Identity in left hand pane u will find
the user, groups, LDAP server, Hierarchy
What you can do is select the user and right click and go to properties, you
will find two tabs named as users and logon, go to user tab and click at
permission button in front of user name you have selected as soon as u click at
permission you will get a new window with user group permission having three
tabs named as general ,query limits and filter and you can specify your
condition at filter tab, in which you can select presentation table
,presentation columns ,logical table and logical columns where you can apply
the condition according to your requirement for the selected user or groups.
If there are 100
users accessing data, and you want to know the logging details of all the
users, where can you find that?
Set the user’s logging level
1. In the Administration Tool, select Manage > Identity.
The Identity Manager dialog box appears.
2. Double-click the user’s user ID. The User dialog box appears.
3. Set the logging level by clicking the Up or Down arrows next to the Logging
Level field
How do implement
event polling table?
In OBIEE Server event polling tables
store information about updates in the underlying databases. These tables are
used for cache management. An application that loads data into a data mart
could be configured to add rows to an event polling table each time a database
table is updated. The Analytics server polls this table at set intervals and
invalidates cache entries corresponding to the updated tables.
Define pipeline.
Did you use it in your projects?
Yes, pipelines are the stages in a
particular transaction, assessment, finance, etc.
How do you work
in a multi user environment? What are the steps?
Create a shared directory on the
network for Multi-user Development (MUD).
Open the rpd to use in MUD. From Tools->Options, setup the MUD directory to
point to the above directory.
Define projects within the rpd to allow multiple users to develop within their
subject area or Facts.
Save and move the rpd to the shared directory setup in point 1.
When users work in the MUD mode, they open the admin tool and start with
MUD ->Checkout to check-out the project they need to work on (not use the
File open as you would usually do).
After completing the development, users check-in the changes back to the
network and merge the changes.
Can you bypass
siebel analytics server security? if so how?
Yes we can by-pass by setting authentication
type in NQSCONFIG file in the security section as: authentication_type =
bypass_nqs.instanceconfig.xml.
What are the
things you can do in the BMM layer?
We apply the business login in the BMM
layer like creating new logical columns, Aggregation navigation, level based
metrics, time series wizard, complex join.
Count (1) and count (*) there is no difference
SELECT count(*) FROM departments ;---
27
select
count(1) from departments;--- 27
SELECT cOUNT(manager_id) FROM departments ;
------ 11
COUNT(*) will return the count of all
rows covered by the query whereas
COUNT(columnname) will not count NULL
values of that specific column.
How do you know
which report is hitting which table, either the fact table or the aggregate
table?
After running the report, go to
“Administration” tab and go to click on “Manage Sessions”. There you can find
the queries that are run and in the “View Log” option in the Session Management
you can find which report is hitting which table.
Suppose I have
report which is running for about 3 minutes typically. What is the first step
you take to improve the performance of the query?
Find the SQL query of the report in
Admin->manage Session-> view log then run the SQL query on toad if it
takes the same time even in TOAD then modify the query to reduce the query
time. If the query runs normally in TOAD then we need to make changes in the
repository.
What is aggregate
navigation? How do you configure the Aggregate tables in OBIEE?
Aggregate tables store pre-computed
results, which are measures that have been aggregated (typically summed) over a
set of dimensional attributes. Using aggregate tables is a very popular
technique for speeding up query response times in decision support systems.
Ex: If you observe that most of the queries are fired on aggregated
values like yearly or monthly data rather that day level data then to speed up
the report we can create an aggregate table containing month level and year
level data and map it to the respective logical table and set the aggregation
levels in the content tab of LTS.
We have 4
dimension tables, in that 2 tables need to have hierarchies then in such a case
is it mandatory to create hierarchies for all the dimension tables?
No, it is not mandatory to define
hierarchies to other Dimension tables.
Can you have
multiple data sources in OBIEE?
Yes, we can have multiple data sources
of different types.
Do you know about
Initialization Blocks? Can you give me an example where you used them?
Initialization blocks are used for
instantiating the value of a variable.
To create dynamic variable you have to create IB to write SQL statement. The
result of the query would be assigned as value to the variable.
What is query
repository tool?
It is utility of OBIEE Admin tool
It allows you to examine the repository metadata
Examine relationship between metadata objects like which column in the
presentation layer maps to which table in physical
layer
Ex: we can search for objects based on name,
type.
Can you migrate
the presentation layer to a different server.
No, we cannot migrate only one
particular layer to another server, we have to migrate the complete repository
or the web catalog.
How do you
identify what are the dimension tables and how do you decide them during the
Business/Data modeling?
Dimension tables contain descriptions
that data analysts use as they query the database.
Ex: the
Product table contains product packaging information; and the Period table contains
month, quarter, and year values. The tables which contain numeric values used
for calculations are used as Fact tables.
Why do we have
multiple LTS in BMM layer? What is the purpose?
To improve the performance and query
response time.
How do i disable
cache for only 2 particular tables?
In the physical layer, double click on
a table on the general tab we have an option Cachable we can either enable it
or disable it for that particular table.
How do you split
a table in the rpd given the condition. ( the condition given was Broker and
customer in the same table) Split Broker and customer.
We need to create alias tables in the
physical layer and use which ever columns are required.
What are the major components in the
OBIEE architecture?
a. Client
b. Presentation services (along with cache)
c. Repository
d. Database connection
e. Enterprise data warehouse
f. Scheduler(along with cache)
What are the different layers of OBIEE Repository?
a. Physical Layer
b. Business Model and Mapping Layer
c. Presentation Layer
What are the folders available in OBIEE?
- Oracle
BI(Administration)
- Oracle
BIdata(analytics)
The folder names
may change with the OBIEE 11g.
What are the Key Configuration Files in OBIEE?
- NQSConfig.ini,
- DBfeatures.ini,
- NQSCluster.ini,
- odbc.ini,
- instanceconfig.xml
What are the
different Log files in OBIEE?
- NQServer.log
- NQSQuery.log
- NQSAdministration.log
- NQS
Scheduler.log
What are the minimum services needed to load a
repository file onto memory and view a dashboard which has reports that have
been refreshed on a scheduled basis?
BI server (Administration Tool)
Presentation Server (Analytics or Answers)
Scheduler server (Scheduling the jobs)
What is the location of the administration configuration files?
drive:\OBIEE 11g\instances\instance1\config\oracleBIservercomponent\
coreapplication_obis1\file name
What is the location of the repository?
drive:\OBIEE 11g\instances\instance1\bifoundation\oracleBIservercomponent\
coreapplication_obis1\repository
What is the location of the presentation services configuration files?
drive:\OBIEE 11g\instances\instance1\config\oracleBIpresentationservices
component\coreapplication_obis1\instanceconfig.xml
What is the location of the administration log files?
C:\OBIEE11g\instances\instance1\diagnostics\logs
What is time
series wizard? When and how do you use it?
o We can do comparison for certain
measures ( revenue.,sales etc.. ) for current year vs previous year, we can do
for month or week and day also
o Identify the time periods need to be compared and then period table keys to
the previous time period.
o The period table needs to contain a column that will contain “Year Ago”
information.
o The fact tables needs to have year ago totals.
o To use the “Time series wizard”. After creating your business model right
click the business model and click on “Time Series Wizard”.
o The Time Series Wizard prompts you to create names for the comparison
measures that it adds to the business model.
o The Time Series Wizard prompts you to select the period table used for the
comparison measures
o Select the column in the period table that provides the key to the comparison
period. This column would be the column containing “Year Ago” information in
the period table.
o Select the measures you want to compare and then Select the calculations you
want to generate. For ex: Measure: Total Dollars and calculations are Change
and Percent change.
o Once the Time series wizard is run the output will be:
a) Aliases for the fact tables (in the physical layer)
b) Joins between period table and alias fact tables
c) Comparison measures
d) Logical table sources
o In the General tab of the Logical table source etc you can find “Generated by
Time Series Wizard” in the description section
o Then you can add these comparision measures to the presentation layer for
your reports.
o Ex: Total sales of current qtrvs previous qtrvs same qtr year ago
What are other ways of improving summary query
reports other than Aggregate Navigation and Cache Management
” Indexes
” Join algorithm
” Mat/view query rewrite
” Web proper report design its optimal by making sure that it is not getting
any addition column or rows
What is query
repository tool?
o It is utility of Seibel/OBIEE Admin
tool
o allows you to examine the repository metadata tool
o for example: search for objects based on name,type.
o Examine relationship between metadata objects like which column in the
presentation layer maps to which table in physical layer
What is JDK and
why do we need it?
o Java Development Kit (JDK), A
software package that contains the minimal set of tools needed to write,
compile, debug, and run Java applets.
Oracle doesn’t
recommend Opaque Views because of performance considerations, so why/when do we
use them?
o an opaque view is a physical layer
table that consists of select statement. an opaque view should be used only if
there is no other solution.
Can you migrate
the presentation layer to a different server.
o No we have to migrate the whole web
& rpd files
Why do we have
multiple LTS in BMM layer?What is the purpose?
o to improve the performance and query
response time.
What is the full
form of rpd?
o there is no full form for rpd as
such, it is just a repository file (Rapidfile Database)
How do i disable
cache for only 2 particular tables?
o in the physical layer, right click
on the table there we will have the option which says cacheable
How do you split
a table in the rpd given the condition.( the condition given was Broker and
customer in the same table) Split Broker and customer.
o we need to make an alias table in
the physical layer.
What
type of protocol did you use in SAS?
o TCP/IP
How many repository files can be loaded to a
BI Server simultaneously? Assume its a single server with single instance of BI
Server running just to keep things
BI Server only can handle one
repository file in online mode.
1. How many tables are needed in
minimum to pass through the Consistency Checking in Logical Layer (Business
Mapping and Modeling Layer) of the repository?
One
dimension and one fact is enough for BMM
2. Can you use an
OLTP backend database for creating a dashboard?
Yes,
it’s nothing but transactional data.
3. Does OBIEE
store physical sql? How is physical sql generated in OBIEE environments?
Yes it stores check in your manage sessions or Nqquery.log..........its
normal SQL
Can i use an OLTP backend database for
creating a dashboard?
Technically you can use OBIEE with OLTP as well.
However real world scenarios pertaining to OLTP makes it difficult for OBIEE to
create Star schema from OLTP. Also OBIEE is an engine to perform analytics
queries, while in most cases queries generated against OLTP schemas are
operational in nature. Better option is to use BI publisher and do away with
OBIEE when querying against OLTP.
OBIEE works with any database if you force to
do. If you want to follow best practices, its recommended to use with OLAP
systems. After all OBIEE is analytics reporting tool and OLAP databases were
designed for reporting requirements. So its always advised use the OLAP to get
better performance and better analytics from OBIEE.